Friends of AI Collective: Story Series
At AI Collective, what we want to do is bring you inspirational stories, to show how anyone can learn and practice data science and machine learning. You do not have to be a researcher or work at an academic health institution with access to a huge EHR database and a team of statisticians. All you need is your curiosity and a willingness to learn. As you will see in this story from Viral and Dalton, Viral, a pharmacist and aspiring data scientist, went from having no background in analytics to taking online classes, to writing code and querying databases, to then ultimately building a model to predict whether someone will visit the emergency within the next year. Although everyone’s journey is different and there is no one right pathway to learning about ML, we hope you will find inspiration from Viral’s story and that it will spark your own curiosity of what is possible to learn.
— Whitley and Christy
A journey into data science and machine learning
By Viral & Dalton
How it all started
Viral: Ever since pharmacy school, I knew I wanted to make an impact beyond just helping one patient at a time. After graduating with my PharmD and MBA, I began working in the managed care space as a clinical pharmacist, and my experience led to a growing interest in leveraging data to individualize healthcare. I understood how important working with data would be to achieving my goals, and so, I started learning the basics in any way that I could; I read Predictive Analytics for Dummies, I used Khan Academy to explore SQL and I took Udemy courses for both Python and Tableau. However, after I grasped the fundamentals, I wanted to find a way to apply what I had learned.
Step 1: Find a Project and Mentor
Viral: After realizing I wanted to find a way to put my new knowledge into practice is when I reached out to Dalton to learn more about data science. In our conversation, Dalton offered to show me the ropes of how to work through a data science project. I knew this was not an experience I could pass up; it would be an opportunity to learn more about how healthcare data can be utilized to improve the lives of patients.
Dalton: Ever since I started my data science job in May 2019, I have made it a priority to share with the pharmacists’ community as much as possible about data science as a career, and how they could pursue this particular career path. That’s how Viral and I first met: he had messaged me on LinkedIn to talk about digital health and data science/analytics. We had a great conversation and talked about the potential of working on a small project, together, where Viral could learn the process of a data science project. No one had asked me about doing a project together before, so I was intrigued. I had come across the Synthea and MIMIC data sets previously (and recommended them to others as datasets that look similar to something you’d find working at a health system), but I hadn’t been able to spend much time doing a deep dive on them.
Step 2: Choose a Dataset
Viral: When we first started the project, I was a deer in headlights in some ways. I did not even know where to start, but luckily, Dalton was there to guide me through each step of the process. The first thing we needed to do was to decide what healthcare dataset we should use and to get a better understanding of that data. We found that MIT’s MIMIC and Synthea’s simulated patient data resembled data you would see working in healthcare, which was important to us as pharmacists. The traditional, basic datasets in machine learning (like the infamous iris dataset, or the popular German credit lending dataset) are great for exploring machine learning concepts, but these healthcare datasets would offer a greater challenge and were, personally, more interesting. After some debate between the two datasets, we ended up choosing Synthea for its ease of access through Excel files and Google’s BigQuery easy-to-use CSV upload tool.
Step 3: Our first hurdle
This project would not be a data science project without encountering some data issues. First, we found out that each of us had downloaded a different dataset from the Synthea website. Synthea allows you to download a dataset of 1 million-plus patients as well as a much smaller sample set of data depending on which page you access on the website. We were able to identify the issue quickly with our initial exploration and reconcile that before continuing on. Another issue we ran into was the format of the 1 million-plus patient dataset. The developers of Synthea had each category of data (ex. labs, meds, encounters) split into ~10 individual CSV files. To make the data easier to work with, we needed to combine the 10 files into a single dataset. In order to accomplish this, we wrote Python code to merge the 10 files into one. This also required making sure that the data structure in each file was similar enough that they could be combined. We came across some issues with one category of files, which had rows with data in the wrong columns, but once we fixed that, we didn’t have any more source data problems.
Step 4: Choose a database platform
Once we consolidated the Synthea dataset into a single CSV file for each data category, we uploaded the data to Google’s BigQuery platform. We ended up selecting BigQuery for a few reasons. It was essentially free with $300 worth of queries to start (for context, by the end of the project, I still had $297.98). We were also able to upload the CSV files directly onto the BigQuery platform through the Google ecosystem. This was important for collaboration purposes, because we were now able to work with our data directly on a SQL platform while sharing queries and output tables between ourselves.
Step 5: Refine the data science question
The next step was to decide what our project should focus on and, ultimately, predict. Initially, we wanted to predict the likelihood that a patient would be hospitalized within the next 12 months. However, after careful consideration, we decided to predict Emergency Department (ED) visits instead of hospitalizations, because ED visits were easier than inpatient visits to identify in the data set based on Synthea’s naming conventions.
Step 6: Prepare and clean the data for analysis
We then proceeded to start the first, and most important step, of the data science life cycle: data clean-up and creating a data set to predict outcomes with. In this step, we wanted to predict ED visits based on the patient population we were targeting and their respective lab values, conditions, and medications. The data in the Synthea dataset was simulated through mid-2017. This required us to identify a couple of time periods that we would need to use for our project. In machine learning, you use data from the past to predict the future likelihood that an event will happen. In addition to medications, lab values, and diagnosis information in a machine learning data set, you also need to have data for the outcome of interest, which, in our case, was ED visits. To make our work easier, we decided to take 2015 patient data to predict 2016 ED visits, because we had access to all ED visits that took place in 2016. With these dates in mind, we could then move on to defining our patient population or identifying the types of patients for which we wanted to eventually predict outcomes.
Viral: Luckily, Dalton had experience with this step and recommended that we limit our population to adults. This meant that we had to remove minors from the dataset as well as those who had died in 2015 or prior. This is where I had a chance to practice building Common Table Expressions (CTE) in SQL. A CTE creates a temporary table to use in your main query, so in this instance, we were able to identify only patients who had an encounter in the year 2015, prior to querying for their age and death dates, and without having to write a separate query and saving those results in their own data table.
Dalton: The thought behind only including patients with encounters in 2015 was another “real-life data science” tip where we only want to focus on patients who are actively using the healthcare entity and not patients who had not been seen recently or seen at other healthcare facilities. Below is the query we actually ran to filter for only adults in our 2015 population, highlighting the use of CTEs. In this code, we used 2 CTEs: one was to replace the null values in the dataset (patients whose birthdate or deathdate was blank) and the second was to clean the data using the safe function. The safe function is used to prevent the code from erroring out when it comes across a piece of data that is not a date. With the CTEs, we were then able to run the final output query to get a table of patient data for patients =>18 years of age, as well as to remove those who had died during or prior to the year of 2015.

The next step in creating our modelling data was to determine which patients in this population went to the ED in 2016. For this, we were able to use a basic left join looking at all of the patients in 2015 and flagging those who had an ED visit in 2016. The end code for this query shows how we were able to see the count of ED visits.

Now that we had the patient population and information regarding whether or not they had an ED encounter in 2016, we wanted to start getting to the clinical aspects of labs, conditions, and medications. This was my first introduction to clinical data, not derived from claims. To start, we reviewed lab values for chronic diseases. This is where I was introduced to LOINC codes, which are “codes for clinical terminology that is important for laboratory test orders and results, and is one of a suite of designated standards for the use in the U.S. Federal Government systems for the electronic exchange of clinical health information.”1 Since patients get multiple sets of labs over time, I had to learn to rank the labs from the newest to the oldest. The code below shows how to rank order a set of data, and then, select the most recent value.

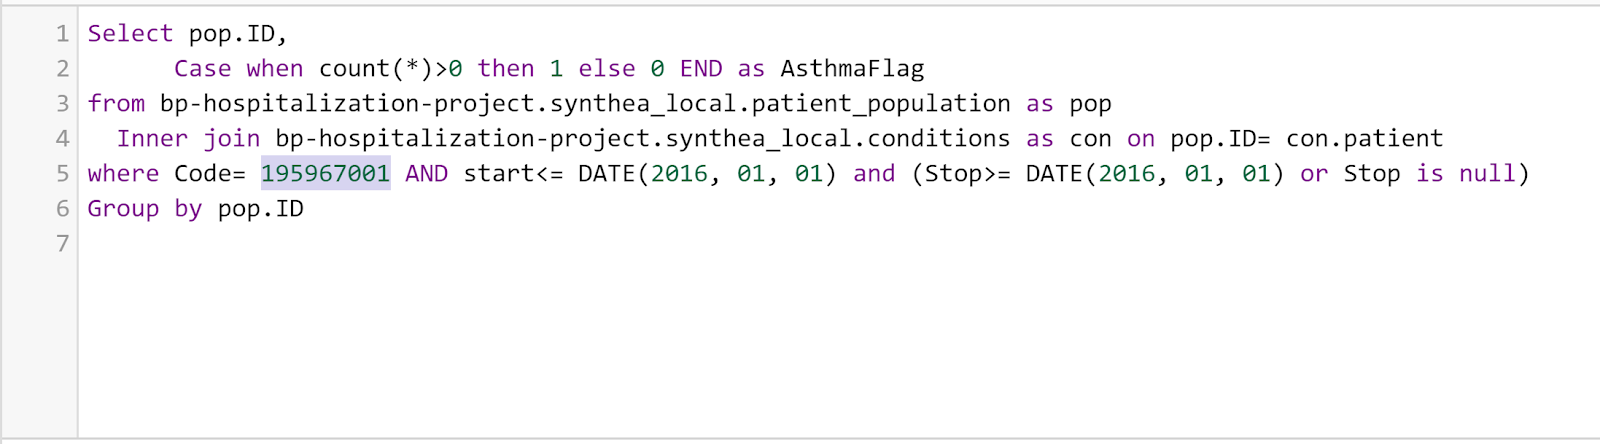
Following labs, we moved onto the diagnoses/conditions of each patient using SNOMED codes. SNOMED codes were designed for clinical documentation inside of an EHR, and are used for reimbursement and statistical purposes. Throughout this process, we focused on using an inner join on the data by looking at our patient population and flagging the patients who had the diagnosis in question (i.e. asthma, in the example below) indicated in their charts. We primarily focused on chronic diseases such as asthma/COPD, diabetes, CAD/MI, hypertension, stroke, ESRD, and Alzheimer’s disease.
Finally, as pharmacists, we wanted to make sure to look at the medications of each patient. In the medications section, we did see strange patterns of data, including situations in which all patients taking a specific class of medication were on the exact same medication despite there being multiple commonly prescribed medications in that class. For example, all patients on a statin were on Simvastatin. For this section of the data, we looked at different classes of chronic disease medications such as pain medications, cancer medications, cardiovascular medications, inhalers, and Fosamax, using their RxNorm codes. The code below shows an example of ensuring that the patient was on the medication during the 2016 period.

All of the previous steps described were used to create the final modeling dataset to use in python. Once in python, we were able to use pandas and scikit-learn to dive deeper into the data, and to look at the number of samples in both of our training and test samples. One of the key lessons that we learned was to check the data for clinical relevance. For example, by checking the array of A1c values, we saw that some patients had an A1c of less than 2, which we know is not possible. We were able to replace all of those values with the mean of the dataset. When we separated the group out to see the number of patients with an ED flag versus the patients that did not, the data were highly skewed, and because of this, we had to perform an upsampling of the data. Upsampling is simply recreating more rows of the minority group (patients who had an ED visit) to match the majority (those without ED visits).
Step 7: Run the model
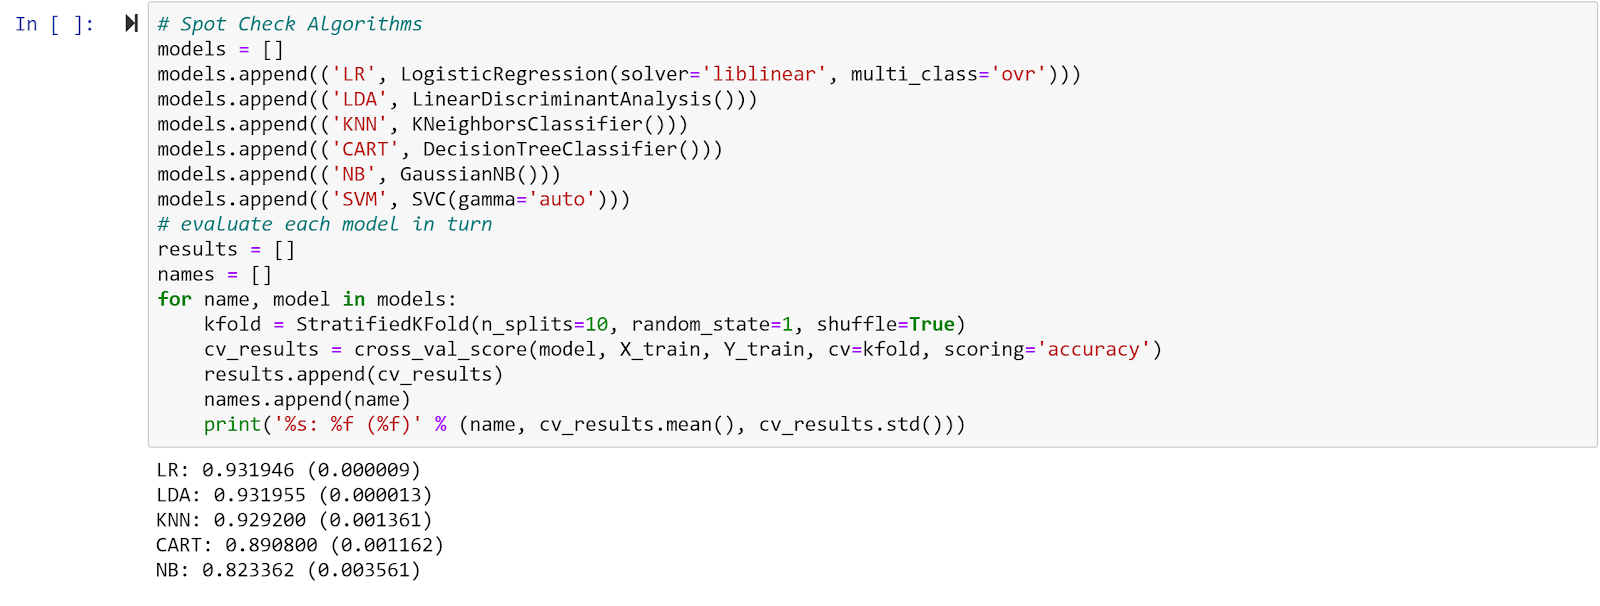
Finally, using scikit-learn, we ran the data with a 70/30 split of training/test data and put it through five different algorithms to see which would give us the highest accuracy of our data. As you can see from the results below, the Logistic Regression and Linear Discrimination Analysis gave us the highest accuracy.
Step 8: Analyze the results
When looking at the results, the accuracy for each model (most over 90% accurate) is much higher than what you would typically see in the literature for this type of analysis. You will also notice that the accuracy is fairly similar between each model. We suspect that one of the reasons the accuracy is so high is because of the nature of the synthetic dataset we used. Since the data is synthetic, it doesn’t have the messiness and inconsistencies you would find with real life data in an EHR; for example, almost all of the patients in Synthea were on the standard medications they should be on for their condition. In real life, the proportion of patients taking the most appropriate medications is actually much lower. Given the lack of variation in the data, it is easier for a machine learning model to predict an outcome because the examples it needs to learn from are all so similar. The true test would be to run one of these models on historical data from a non-synthetic dataset and see if the model is able to generalize to the real world data and maintain its high accuracy.
In Summary:
In true data science project fashion, we had to make a few pivots along the way in terms of what our project would involve. We had intended to predict the likelihood that patients would be hospitalized in the next 12 months instead of the likelihood of an Emergency Department visit in the next 12 months, which is what we eventually settled on. We also initially planned to only include a few features (items being used to predict the outcome) to make our project easier to work on, but we ended up including more features than we originally thought (29 features spanning the 4 categories of previous utilization, medications, labs, and disease states). Lastly, we had planned to use a SQL Server database for our project, but we found an easier way to upload the Synthea data into a database. We knew we wanted to upload the Synthea CSVs onto a database so that we could write SQL. SQL is an integral part of the data science lifecycle as most data you’ll work with at a health system, for example, is in a SQL database. Using SQL Server would require us to download and configure some additional resources we did not have. Ultimately, we found that Google BigQuery would allow us to upload the Synthea CSVs and it would automatically convert the data into a SQL-accessible database. Google BigQuery also allowed us to save and share both SQL code and the output of queries, which was useful for collaborating.
References:
Authors
Dalton Fabian
Viral Panchal
AI Collective Guest Contributor
Dalton Fabian, PharmD, RPh, is a pharmacist with a passion for technology and data science who serves as a Data Science Analyst at UnityPoint Health in Des Moines, IA. In his role, Dalton utilizes machine learning to improve clinical care, promote value-based care, and assist strategic planning within a large health system. His team’s work has been featured in national press and most recently won the Creative Technology Solution of the Year in the 2020 Prometheus Awards hosted by the Technology Association of Iowa. Dalton is passionate about helping more pharmacists find roles in data science. He is also active in the Iowa Pharmacy Association, American Pharmacists Association, and American Society of Health-System Pharmacists.
AI Collective Guest Contributor
Viral Panchal, PharmD-MBA, is a pharmacist with a passion for digital health who is currently transitioning to a new role as a clinical product specialist at Komodo Health, a healthcare analytics startup. Previously, he worked in a managed care setting to analyzing the clinical and economic burden of high risk patients and designing initiatives to help patients navigate the complexities of healthcare. His goals are to ultimately help personalize healthcare through the power of data.